Fleet Uniform Life-Cycle Costs: Calculating True ROI in High-Frequency Logistics Operations
The math is straightforward: a $12 uniform that lasts 15 washes costs $0.80 per wear. A $25 uniform that lasts 80 washes costs $0.31 per wear. The premium option is 2.5x cheaper per use—but most procurement teams never calculate cost-per-wear because they're looking at the wrong number on the PO.
This is the most expensive blindspot in fleet uniform procurement. Buyers optimize for unit price, not lifecycle cost. The result: cheaper uniforms that fail faster, need replacement sooner, and cost more over the life of the program.
This guide walks through the real math of fleet uniform procurement—fabric durability, wash lifecycle, decoration adhesion, and the logistical costs that eat margin when you're not tracking them. It's written for fleet managers, logistics coordinators, and enterprise procurement teams who need to show leadership that the "cheaper" option is actually the expensive one.
1. Sourcing Realities: What Fleet Managers and Logistics Coordinators Overlook Regarding Uniform Life-Cycle Economics
The quote comes in: $12 per polo for a promotional-grade shirt. Another supplier quotes $25 for a fleet-grade twill. The procurement team looks at the difference—$13 per unit, times 300 units—and sees a $3,900 savings. The promotional shirt wins the PO.
That math is wrong. The calculation that matters isn't unit price—it's cost-per-wear, factoring in replacement frequency, laundry durability, and crew downtime for uniform distribution.
Here's the pattern we see across fleet programs: a buyer selects a retail-weight uniform that looks acceptable in the catalog. The first 15 washes are fine. By wash 25, the fabric is showing wear at the elbows and knees. By wash 35, the logos are fading, the seams are straining, and the crew is asking for replacements. The program is now on its second replacement cycle in less than a year. The "savings" from the cheaper uniform have been erased by twice the reorder frequency—and no one tracked the hidden cost.
The honest answer depends on things suppliers don't always tell you upfront: the industrial tensile endurance of the fabric, the laundering crocking metrics, and the logistics routing buffer time required for multi-hub distribution. These aren't marketing claims—they're objective performance indicators that determine whether a uniform program saves money or drains it.
2. Textile Physics: The Structural Science Behind Fleet-Grade Uniform Durability
Fabric durability in fleet applications comes down to three variables: fiber type, yarn construction, and finishing treatment. Each contributes to the industrial tensile endurance that separates a 15-wash garment from an 80-wash garment.
Fiber composition is the first variable. A 65/35 polyester-cotton blend delivers the optimal balance: polyester provides strength, wrinkle resistance, and dimensional stability; cotton contributes moisture balance and comfort. Higher polyester content (80/20) improves durability further but reduces breathability. Lower polyester content (50/50) feels softer but lacks the industrial tensile endurance for fleet use. The blend ratio directly affects breaking strength—ASTM D5034 tests on 240 GSM twill typically show 35–45 lbf in warp direction, versus 20–28 lbf on 160 GSM poplin.
Yarn construction is the second. High-tenacity ring-spun yarns have tighter twist and superior alignment compared to open-end or carded yarns. The tighter structure resists abrasion and maintains dimensional stability through repeated laundering. Open-end yarns—common in budget uniforms—have lower tensile strength and shed fibers faster, accelerating pilling and wear.
Finishing treatments are the third. A soil release fluorocarbon finish creates a low-surface-energy barrier that repels oil and grease. Without it, a uniform that looks professional at shift start looks like a rag by lunch. The finish extends the professional appearance window by 20–30 washes, meaning the uniform is retired for cosmetic reasons later—not sooner.
These aren't theoretical differences. They translate directly to the 3–4x lifespan extension that makes the premium uniform cheaper per wear. The spec exists. The product often doesn't match it—unless you verify.
3. Workshop Execution: Calibrating Decoration Methods for Fleet Uniforms
Decoration durability in fleet applications is as critical as fabric durability. A logo that cracks, fades, or delaminates after 20 washes effectively retires the uniform early—regardless of the fabric's remaining life. The economic equation: decoration failure cuts uniform life in half, doubling the cost-per-wear.
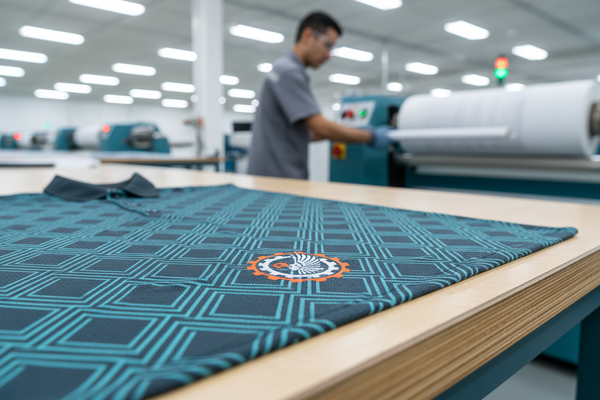
Screen printing on fleet-grade fabrics requires different parameters than printing on retail-weight poplin. Heavier twill needs higher squeegee pressure to push ink into the weave. Mesh count should be lower—110 to 156 threads per inch—to deposit sufficient ink film thickness. Cure temperature needs calibration: polyester-blend fabrics require 160–170°C for proper ink cross-linking, but exceeding 180°C risks dye migration from the synthetic fibers. The window is narrow—and the factory needs to know your exact blend ratio to set the dryer correctly.
Embroidery on fleet uniforms delivers the longest decoration life—often outlasting the garment. But embroidery on poly-cotton twill requires specific digitizing parameters. The needle compression is different from lightweight fabrics. The fix is pull-compensation vector digitizing with values calibrated to the specific GSM and weave structure. For fleet programs, the initial digitizing cost ($50–95) is quickly amortized over 5–7 years of uniform life.
Heat transfer is the fastest option for fleet programs—3–5 day turnaround—but the durability trade-off is significant. Heat transfer on poly-cotton typically delivers 20–30 washes before cracking or peeling. That's acceptable for short-term promotional programs, but for ongoing fleet use, the replacement frequency erodes the initial savings.
One universal rule for fleet decoration: test on production fabric, not on the supplier's test swatch. Run adhesion, wash, and stretch tests on samples cut from the actual production roll. If the supplier won't provide a production roll sample for testing, that's a red flag.
4. Risk Factors: Preventing Severe Operational Flaws in Bulk Runs
Bulk production amplifies every small variance. A 1% difference in polyester content changes the dye uptake and the shrinkage behavior. A 2% variation in finishing tension alters the fabric weight and the hand feel. Here are the operational failures I see most often in fleet uniform programs—and how to prevent them.
Laundering crocking failure is the invisible killer of fleet uniform programs. When dyes aren't properly fixed to the fibers, they transfer during washing—dark logos onto light shirts, dark colors onto light trim. The root cause is inadequate dye fixation or improper after-treatment. The fix is AATCC 8 crocking testing on every production lot, with minimum Grade 4.0 on the Gray Scale for Staining. This simple test—a 10-second friction test with a white cloth—catches failures before they reach your crews.
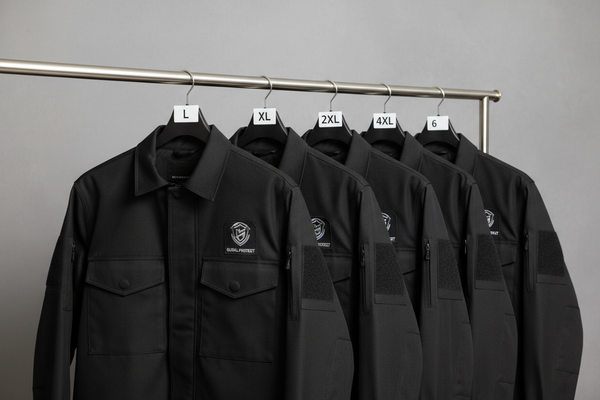
Retroreflective tape delamination shows up after the first industrial wash. The tape separates from the fabric, the reflective layer cracks, or the adhesive fails. The root cause is using tape that wasn't certified for the specific fabric substrate and wash protocol. The fix is specifying retroreflective materials with ANSI/ISEA 107 certification and requiring tape suppliers to provide wash test data for your specific fabric. Not all tape works on all substrates—and the factory's standard tape might not work on yours.
Soil release finish degradation is the most common invisible failure. The fluorocarbon treatment wears off after 10–15 washes, and suddenly the uniforms start absorbing oil and grease. The root cause is either inadequate application (the finish wasn't properly cured) or incompatible wash chemistry (alkaline detergents degrade fluorocarbons). The fix is the water bead test: drip water onto the fabric from 12 inches. If it beads and rolls off, the finish is intact. If it spreads or absorbs, the finish is gone.
Logistics routing buffer time neglect is the self-inflicted wound that kills more fleet rollouts than any quality issue. Procurement teams calculate delivery from factory gate to port and stop there. They forget the regional sort, the last-mile truck, the warehouse receiving backlog. The fix is the 14-day rule: add 10–14 days of logistics routing buffer time for multi-hub distribution. That covers the port delay, the regional sort, and the truck that breaks down.
5. Procurement Ledger: Cost Amortization Specs for Bulk Fleet Uniform Programs
The cost-per-wear math is straightforward, but most procurement teams never run it because they're optimizing for the wrong metric. Let's fix that.
The cost-per-wear calculation: Total landed cost per garment divided by expected wash cycles. Apply this to your uniform program budget, and the picture changes dramatically.
Scenario 1: Retail-Grade 160 GSM Poplin — Landed cost: $14 per unit. Expected wash cycles: 15–25. Cost-per-wear: $0.56–0.93. Replacement frequency: 2–3x per year. Annual uniform cost per employee: $28–42 per year in garment costs alone.
Scenario 2: Fleet-Grade 200 GSM Twill — Landed cost: $20 per unit. Expected wash cycles: 40–60. Cost-per-wear: $0.33–0.50. Replacement frequency: 1x per year. Annual uniform cost per employee: $20–25 per year.
Scenario 3: Heavy-Duty 240 GSM Twill — Landed cost: $26 per unit. Expected wash cycles: 60–80. Cost-per-wear: $0.33–0.43. Replacement frequency: <1x per year. Annual uniform cost per employee: $16–22 per year.
The premium fabric delivers 2–3x lower cost-per-wear than retail-grade. But the math doesn't stop at material cost—you also factor in replacement administration costs: ordering, receiving, distributing, and managing employee sizing. Each replacement cycle adds administrative overhead that the per-wear calculation captures if you track it.
Now factor in the logistics routing buffer time. A program that ships to one central location is different from one that serves 20 regional depots. The distribution overhead—sorting, labeling, shipping, receiving—can add 15–25% to the landed cost per unit. The 14-day rule isn't just about timing—it's about cost predictability.
One cost trap for fleet programs: rush fees for replacement orders. If you're replacing uniforms 2–3x per year, you're paying a 20–30% premium for Express Manufacturing Lane production on every reorder. That premium compounds. The solution is multi-tier rolling buffer stocks: 10–15% buffer held at the factory, released quarterly to cover attrition. The buffer carries a storage fee—typically 2–3% of order value annually—but eliminates the rush fee premium and the logistics panic.
6. Engineering Benchmark Profiles: AATCC/ASTM Lab Threshold Metrics
| Test Method | Parameter | Fleet-Grade Threshold | Retail-Grade Typical |
|---|---|---|---|
| AATCC 61 | Colorfastness to Laundering | ≥ 4.0 (Gray Scale) after 20 cycles | Grade 3.0–3.5 after 10 cycles |
| AATCC 8 | Colorfastness to Crocking | ≥ 4.0 (dry) / ≥ 3.5 (wet) | Grade 3.0–3.5 dry / Grade 2.5–3.0 wet |
| AATCC 135 | Dimensional Stability | ≤ 3% warp / ≤ 5% weft after 5 cycles | 4–6% warp / 5–8% weft |
| ASTM D5034 | Breaking Strength | ≥ 35 lbf (warp) / ≥ 30 lbf (weft) | 20–28 lbf warp / 18–24 lbf weft |
| AATCC 20 | Fiber Composition Analysis | ± 3% of stated blend ratio | ± 5% or unspecified |
| ANSI/ISEA 107 | Retroreflective Performance | Class 2: ≥250 cd/lx/m² | Not tested or sub-Class 1 |
These thresholds represent the difference between a 15-wash garment and an 80-wash garment. If your supplier can't commit to fleet-grade thresholds in writing—or won't provide independent lab results—the "savings" from retail-grade will be erased by 2–3x higher replacement frequency.
7. Fatal Sourcing Gaps: Destructive Blindspots in Quality Control
Most fleet uniform quality control plans focus on what you can see: print alignment, seam straightness, loose threads. But the failures that kill fleet programs are invisible at the inspection table. They show up in the laundry room, in the vehicle cab, or in the crew member's body six months later.
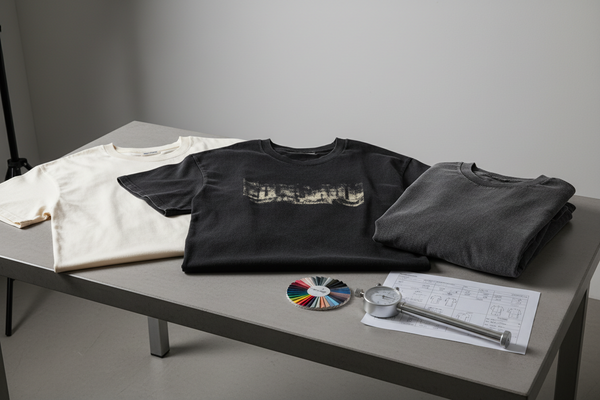
The blend ratio substitution. The mill specs 65/35 poly-cotton. But polyester prices fluctuate. Mid-production, the mill increases the polyester content to 70/30—cheaper, more available—to protect their margin. The fabric weight stays the same because they adjust the yarn count. But the dye uptake changes: higher polyester content means lighter color, different hand feel, and reduced breathability. You won't see it in the inspection. You'll see it when the crew complains that the uniforms are "stiffer" and "don't breathe." The fix? Require AATCC 20 fiber composition analysis with every shipment. Test it. Reject deviations.
The finish skip. The soil release fluorocarbon finish is an extra step. The factory skips it to save time and money. The fabric passes your incoming inspection—the weight is right, the color matches. But the first oil stain sets permanently. The uniform never comes clean. The fix? The water bead test on every production lot, not just the sample. Drip water from 12 inches. If it doesn't bead, reject the lot.
The tape substitution. You specified ANSI/ISEA 107 Class 2 retroreflective tape. The factory substitutes a non-certified tape that looks identical—until the first wash. The reflective layer cracks, the adhesive fails, and the tape delaminates. The fix? Require tape certification with every shipment. Test the tape's retroreflective coefficient with a portable reflectometer. Reject deviations.
The logistics buffer omission. The production timeline is tight—12 days to completion. But the factory's freight forwarder books standard ocean freight, not expedited. The container sits at the port for 5 days waiting for a vessel. Customs clearance takes another 4 days. Regional distribution adds 10 days. The uniforms arrive 3 weeks late. The fix? The 14-day rule: add logistics routing buffer time to every timeline. Not 5. Not 7. Fourteen. That covers the port delay, the regional sort, and the last-mile truck.
8. Supply Chain FAQ Summary: Verified Action Ledger FAQ
Q: What's the minimum order quantity for a fleet uniform program with custom fabric?
Most full-service manufacturers set MOQ at 300–500 units per color for custom fabric production. If you're using stock fabric (blanks that the factory already produces), MOQ can drop to 100–200 units. The Bulk Contract MOQ Tier structure allows for phased rollouts: Tier 1 (500+ units) at base pricing, Tier 2 (200–499) at 5–8% premium, Tier 3 (50–199) at 10–15% premium.
Q: How do I verify that the factory is actually using the specified poly-cotton blend ratio?
Two methods. First, request yarn certification from the mill—this should specify blend ratio, yarn count, and twist level. Second, run AATCC 20 fiber composition analysis on a production sample. The test identifies fiber content within ±3% accuracy. If the lab report shows higher polyester content than specified, you've got a substitution.
Q: What's the typical timeline from tech pack submission to crew locker for a fleet program?
Assuming a 300-unit run with custom-dyed 200 GSM poly-cotton twill and 2-color screen print: 7–10 days for sample development, 3–5 days for sample approval, 15–20 days for production, 5–7 days for QC and packaging, 12–18 days for sea freight to a US port, and 10–14 days for regional distribution. Total: 52–74 days. Express Manufacturing Lane can reduce production to 5–7 days with a 20–30% premium. Plan for the longer timeline and celebrate the early arrival.
Q: How do I protect my fleet program against color variance between production runs?
Require Spectral Pantone coordinated matching with digital tolerances. The supplier formulates dye to match a digital spectral curve, eliminating subjective interpretation. Require that all fabric comes from a single dye lot. For reorders, request that the mill retain a physical color standard from your initial production. Digital matching is helpful but not sufficient—fabric texture affects perceived color. A physical standard is the only reliable reference.
Q: What's the real cost difference between a premium fleet uniform and a budget fleet uniform over 3 years?
Premium: 240 GSM heavy-duty twill with soil release finish, 2-color screen print, and retroreflective tape. Landed cost: roughly $24–28 per unit. Budget: 160 GSM poplin with no finish, 1-color heat transfer, no reflective tape. Landed cost: roughly $14–18 per unit. The premium uniform lasts 3–4x longer—60–80 wash cycles vs. 15–25. Over 3 years, the premium uniform costs $0.31 per wear vs. $0.80 for budget. The premium option is 2.5x cheaper per use.
Q: How do I handle quality disputes with an overseas supplier?
Three rules. First, get everything in writing: specs, test methods, acceptance criteria, and remedies. Second, use a third-party inspection service (e.g., Bureau Veritas, SGS) for pre-shipment inspection—this gives you independent leverage. Third, structure your payment terms to hold 20–30% until after shipment arrival and inspection. If the supplier knows you can withhold payment, they'll prioritize your quality. If you pay 100% upfront, you're buying their problems.
This guide was developed by the sourcing team at apparellots.com, based on factory-floor experience and procurement data from hundreds of fleet uniform programs. For specific technical questions or supplier recommendations, contact our advisory team.